South Africa’s Changing Marriage Landscape: A Decade in Review
South Africa’s marriage landscape is undergoing a quiet but steady transformation. The latest data from Statistics South Africa reveals a country where fewer people are getting married, more are waiting longer to tie the knot, and divorce rates are on the rise. These trends paint a picture of shifting societal priorities and changing views on commitment.
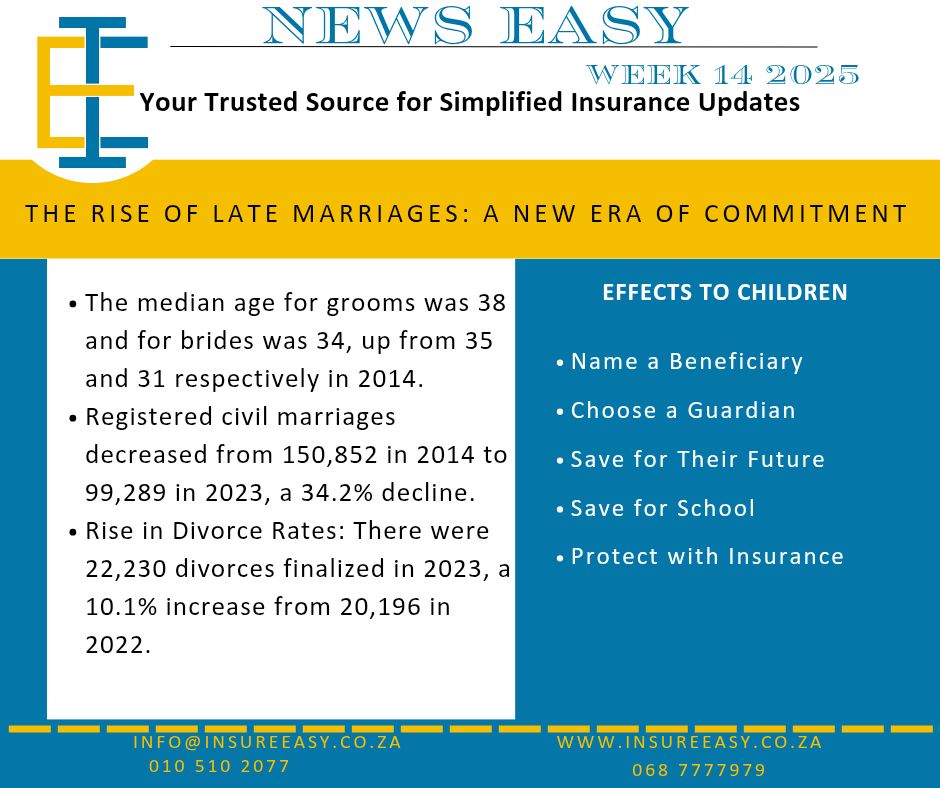
Decline in Marriage Rates
Marriage, once a defining milestone of adulthood, is no longer the default path for many South Africans.
Total recorded marriages and unions in 2023: 105,123
Civil marriages: 99,289
Customary marriages: 3,537
Civil unions: 2,297
Decline in civil marriages: From 150,852 in 2014 to 99,289 in 2023
Percentage drop over the past decade: 34.2%
This decline reflects a broader global trend of people choosing alternative paths to partnership and family life.
Increasing Age at First Marriage
One of the most significant shifts has been in the age at which South Africans are choosing to marry.
Median age of grooms in 2014: 35 years
Median age of grooms in 2023: 38 years
Median age of brides in 2014: 31 years
Median age of brides in 2023: 34 years
This trend signals that people are prioritizing education, careers, and financial stability before making marital commitments.
Shifts in Age Distribution Among Newlyweds
The age profile of newlyweds is also changing:
In 2014, most grooms were aged 30–34, and most brides were 25–29.
In 2023, the most common age group for brides shifted to 30–34 years.
In 2023:
75.2% of grooms were older than their brides
16.1% married older women
8.6% married someone of the same age
These figures point to broader changes in gender roles and expectations within relationships.
Divorce Rates on the Rise
With fewer people getting married, one might expect a decline in divorces—but the opposite is true.
Finalized divorces in 2023: 22,230
Increase from 2022: 10.1% (from 20,196 divorces)
Percentage of divorces after less than 10 years of marriage: 42.0%
Median age at divorce:
Men: 46 years
Women: 42 years
These numbers suggest that even when couples do marry, sustaining the union over time remains a challenge.
Conclusion
South Africa’s marriage statistics reveal more than just numbers—they tell the story of a society redefining love, commitment, and family. As traditional timelines shift and individuals take longer to settle down, marriage becomes more a choice than a given. The rising divorce rates further emphasize the need for deeper conversations about relationship expectations and support systems.